Overbought asset hints at impending correction. Undersold asset signals potential buying opportunity.
The Polarized Fractal Efficiency (PFE) is a financial indicator created by Hans Hannula. It measures the efficiency of price movement in a financial market, helping to identify trends and reversals. The PFE is based on fractal geometry and evaluates the price movement’s efficiency by comparing the actual distance traveled by prices to the theoretical straight-line distance over a given period.
To calculate the PFE, follow these steps:
Calculate the Euclidean Distance: This is the straight-line distance between the starting price and the ending price over a given period \( N \), which is typically 5 to 10 days in case of daily data. The formula is:
\[ D_{\text{straight}} = \sqrt{(P_t - P_{t-N})^2 + N^2} \]
where \( P_t \) is the current price, and \( P_{t-N} \) is the price \( N \) periods ago.
Calculate the Actual Distance Traveled: This is the sum of the absolute price changes over the same period:
\[ D_{\text{actual}} = \sum_{i=1}^{N} |P_{t-i+1} - P_{t-i}| \]
Calculate the Fractal Efficiency Ratio: This ratio compares the Euclidean distance to the actual distance traveled:
\[ \phi_ = \frac{D_{\text{straight}}}{D_{\text{actual}}} \]
Calculate the PFE: The PFE adjusts the Fractal Efficiency Ratio to provide a clearer signal, considering the direction of the price movement:
\[\text{PFE} = 100 \times \text{sign}(P_t - P_{t-N}) \times \sqrt{\frac{\phi - \phi_{min}}{\phi_{max} - \phi_{min}}}\]Here, \(\phi_{min}\) and \(\phi_{max}\) are the minimum and maximum possible values of the Fractal Efficiency Ratio over the period considered. (Note that PFE is often filtered by a 10-period exponential moving average.)
In essence, the PFE quantifies how directly prices have moved from point A to point B, with higher values indicating more efficient, trend-like movements and lower values indicating more erratic, less efficient movements. Traders use PFE to gauge the strength and direction of trends, helping them make more informed trading decisions.
Illustration in Mathematica
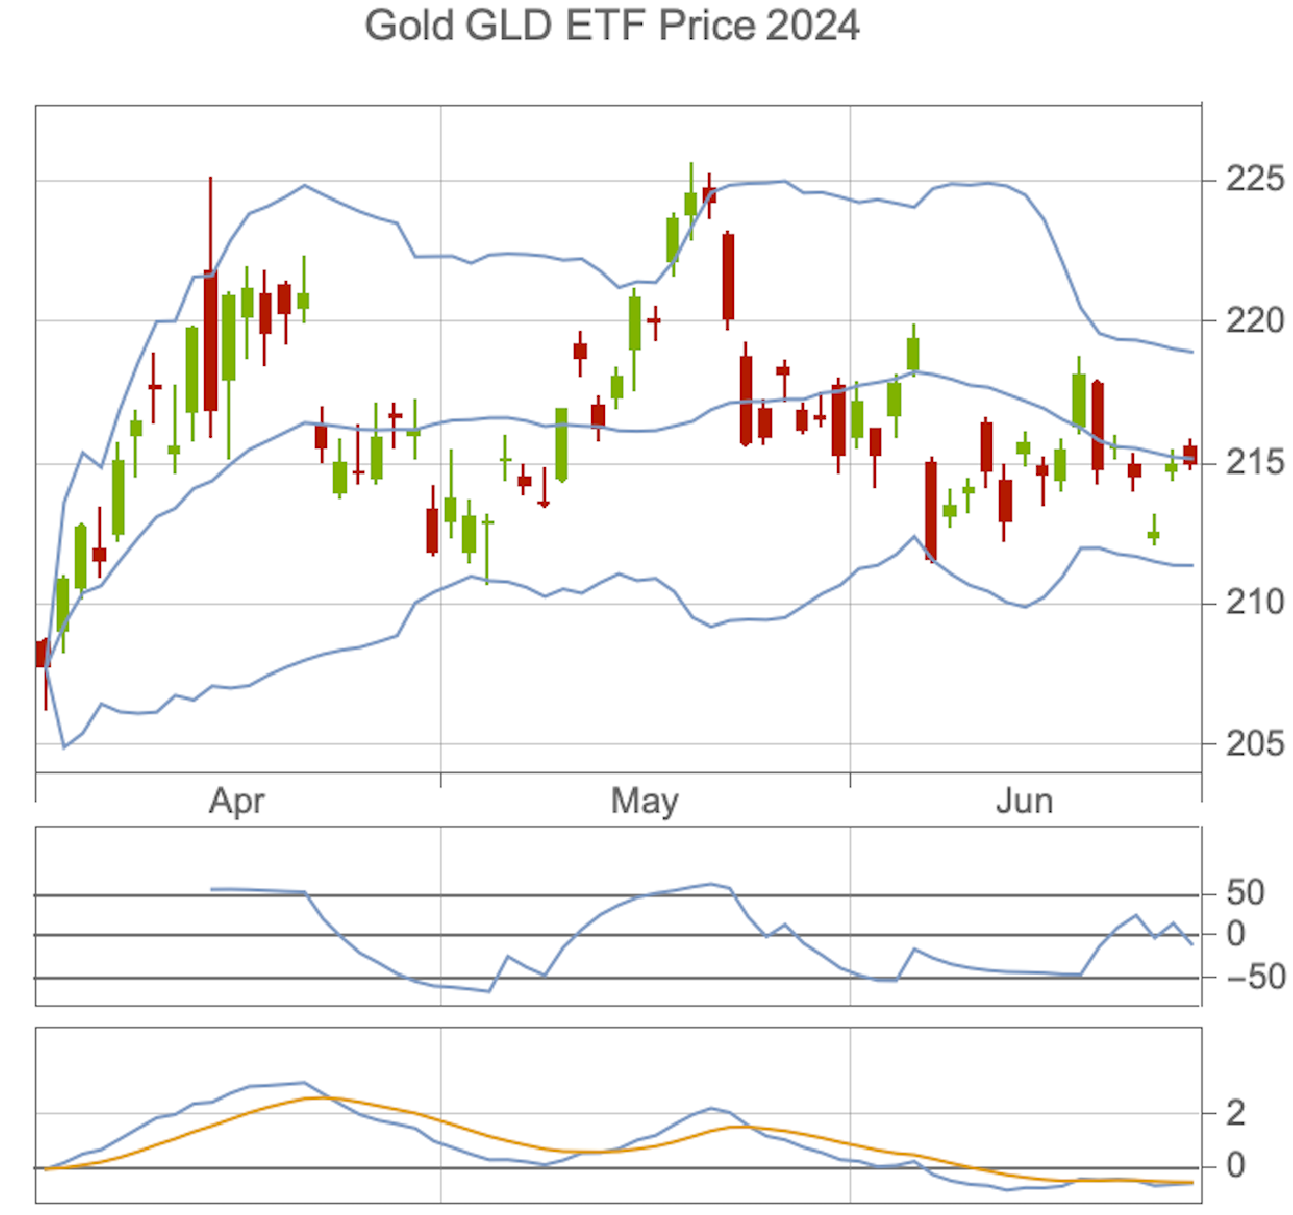
If you happen to have Mathematica, you can see PFE in action using the TradingChart command
TradingChart["GLD", {"PolarizedFractalEfficiency", "BollingerBands"},
 PlotLabel -> "Gold GLD ETF Price 2024"]

PFE (2nd from top) and MACD (3rd from top) help traders choose entry and exit points
Benefits to traders
PFE indicator offers traders insights into the efficiency and direction of price movements. A high positive PFE value signals a strong upward trend, while a high negative PFE value indicates a strong downward trend. Low PFE values, near zero, suggest inefficient price movement, often seen in range-bound markets.
PFE measures how directly prices are moving in a trend. Higher values mean more efficient, direct trends, while lower values indicate more volatility and less consistency.
Traders can use PFE to assess trend strength and efficiency, aiding in decision-making.
For practical use, traders might enter a position when PFE is high and aligns with the desired trend direction. A decreasing PFE could signal the trend is losing efficiency, suggesting it might be time to exit the position. Additionally, PFE can confirm trends when used alongside other indicators. For instance, if a MACD shows a bullish signal and PFE is also high and positive, this strengthens the case for a long position.
By tracking changes in PFE values, traders can assess market volatility and adjust their strategies accordingly. For example, if a stock’s PFE value starts high but decreases significantly over a few days, a trader might enter when PFE is high and exit as it declines, anticipating a potential trend reversal.
PFE reveals price efficiency and direction.
Integrating PFE with other analysis tools can enhance trading strategies and risk management.